Polynomial Regression
Predict RSV in USA using CDC data
Trend in USA
- In most regions of the United States, RSV circulation starts in the fall and peaks in the winter.
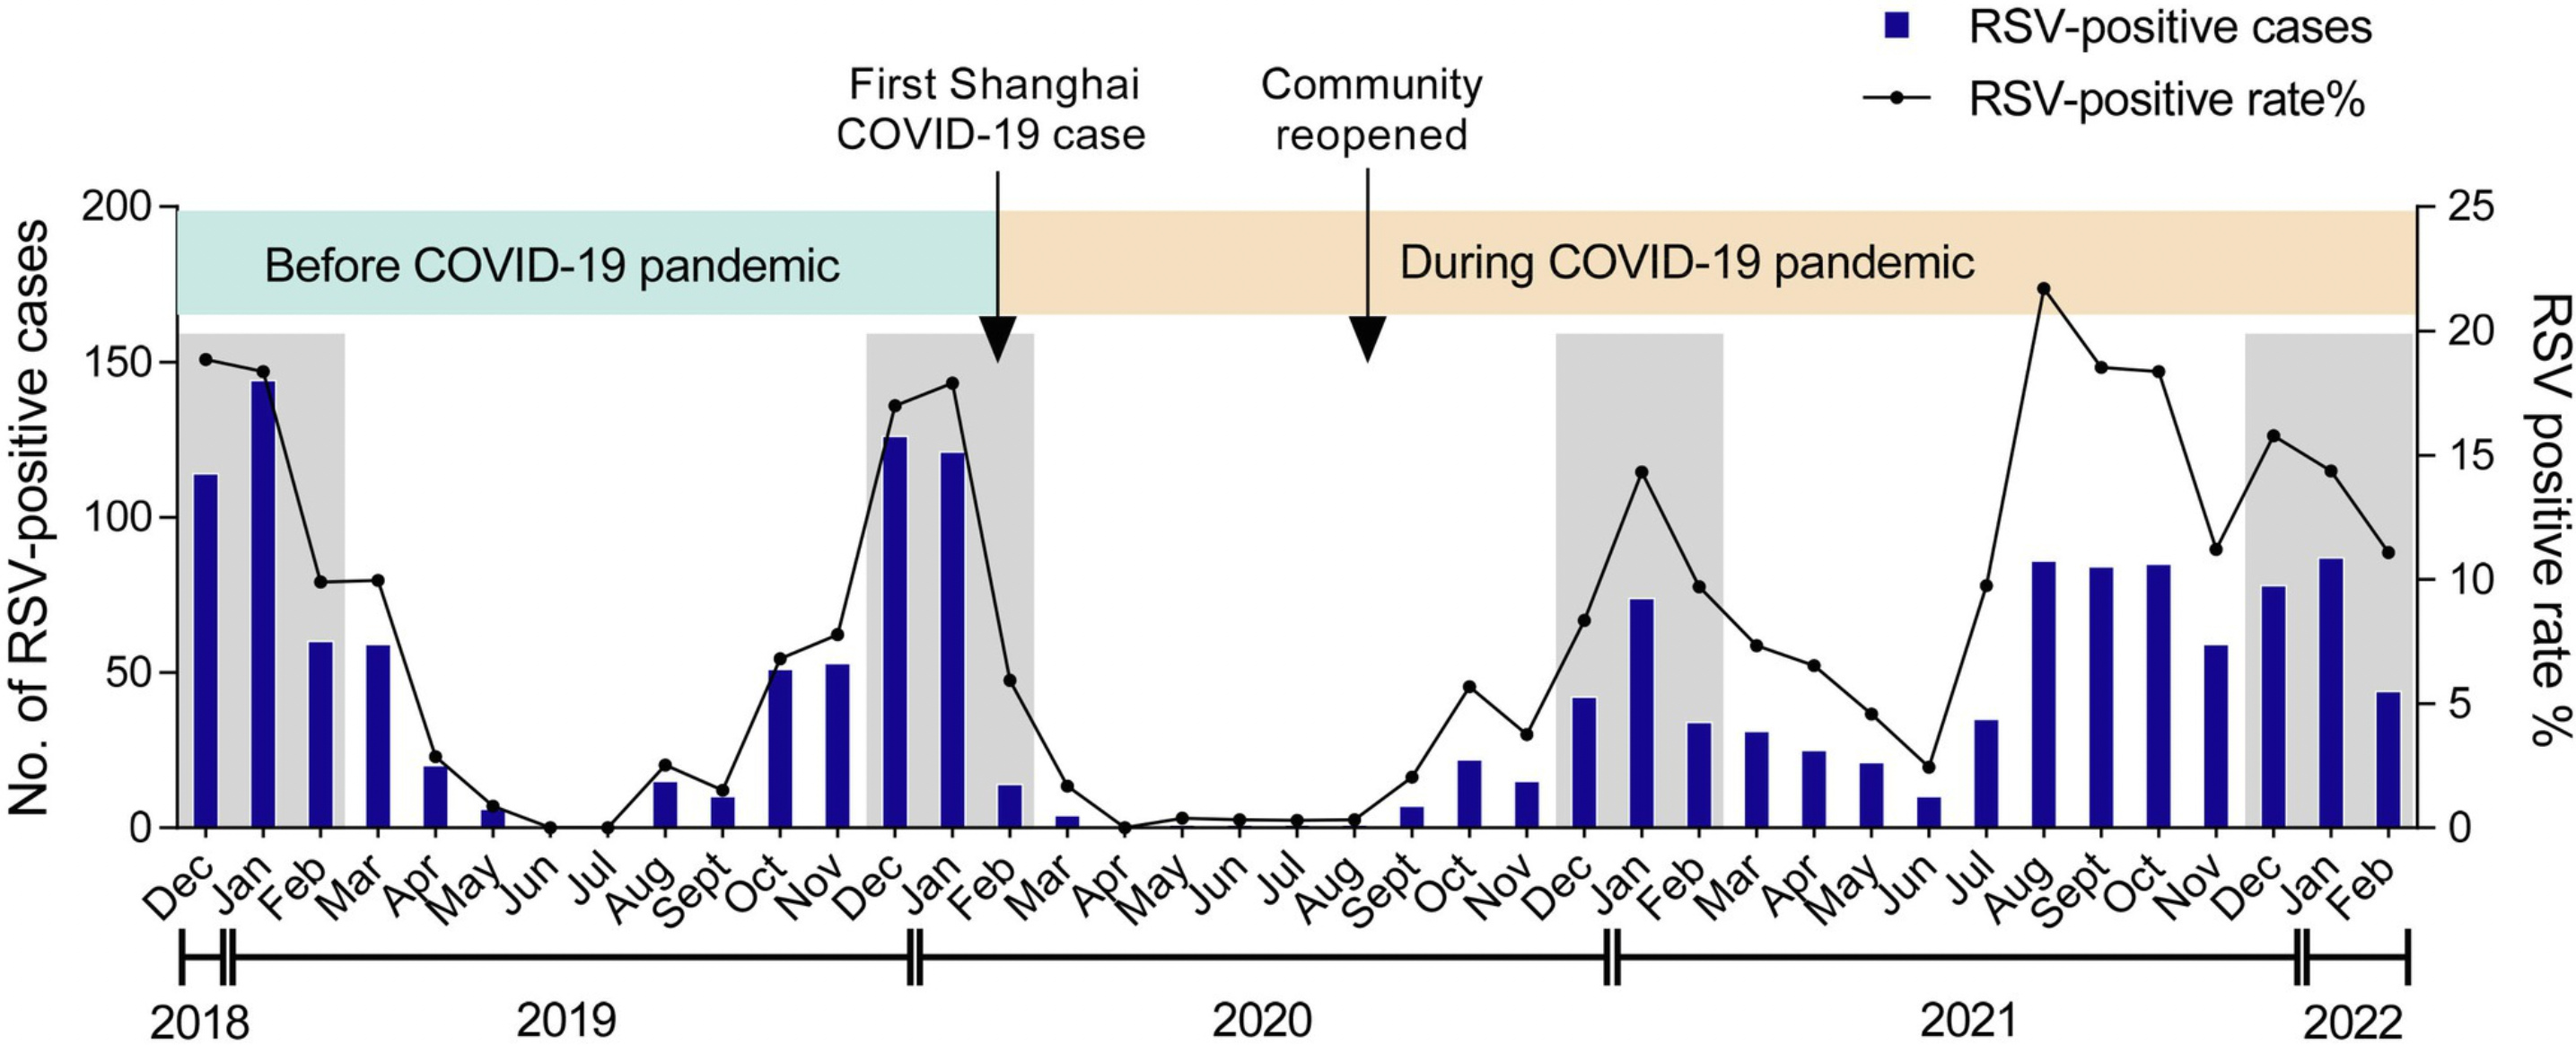
With mask-wearing and physical distancing for COVID-19, there were fewer cases of RSV in 2020.
RSV cases began to increase in spring 2021 when safety measures relaxed with the arrival of COVID-19 vaccines.
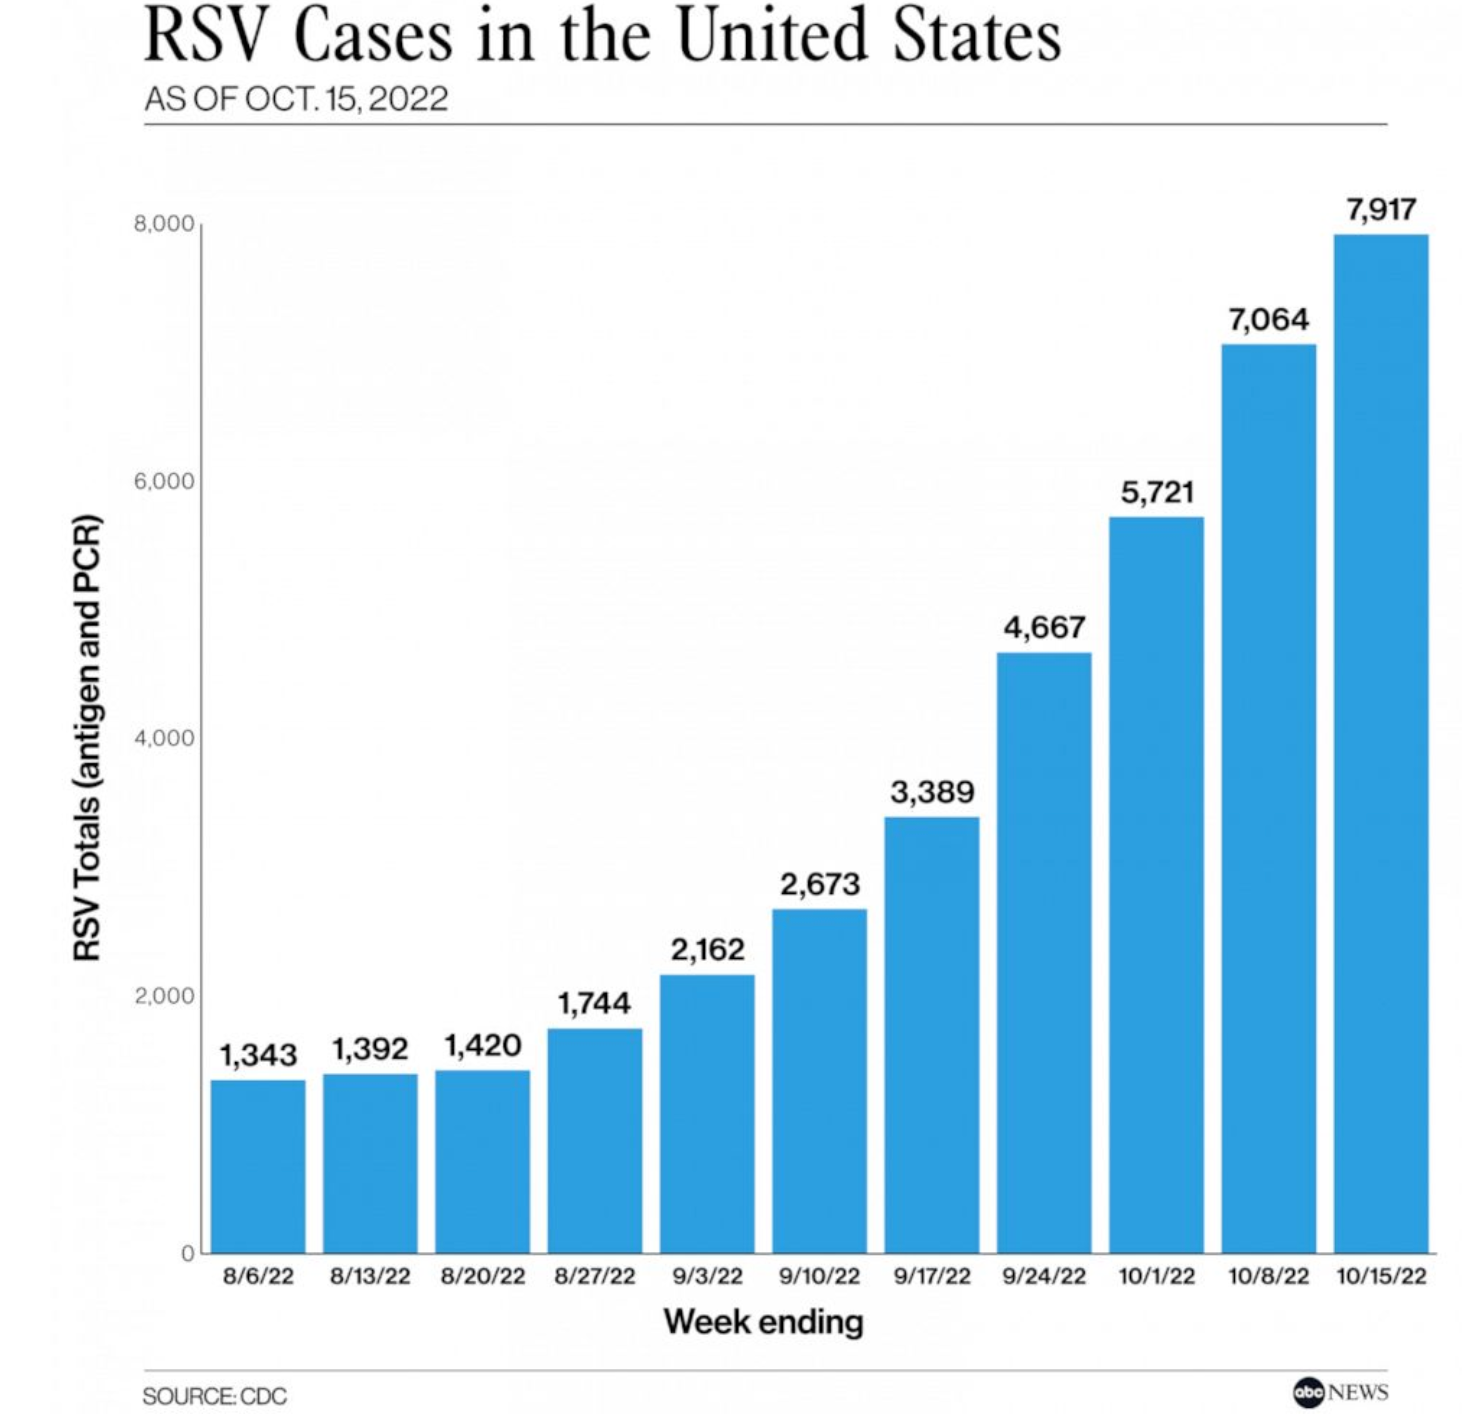
This year, RSV in multiple U.S. regions are nearing seasonal peak levels.
About Data
Data set for this research is from RSV Hospitalization Surveillance Network (RSV-NET) (one of CDC research and surveillance platforms).
RSV-NET has been collecting RSV-associated hospitalizations in adults and children since 2018-2019 season from 58 counties in 12 states, including California, Colorado, Connecticut, Georgia, Maryland, Michigan, Minnesota, New Mexico, New York, Oregon, Tennessee, and Utah.
They conduct population-based surveillance system for laboratory-confirmed COVID-19, RSV, and influenza-associated hospitalizations in the US among children younger than 18 years of age and adults.
A case is defined by laboratory-confirmed RSV in a person who lives in a defined RSV-NET surveillance area and Tests positive for RSV withn 14 days before or during hospitalization.
Time frame: In season 2018-2019, 2019-2020, data collected is from October 1 to April 30. In season 2020-2021, 2021-2022, 2022-2023, data collected is from October 1 to October 1 next year.
- Data was last updated on 17th November 2022.
- Oneyear Data: Rate/wk for 52 weeks(YTD)
- Twoyear Data: Rate/wk for 104 weeks(YTD)

Why Polynomial Regression
Simple Linear Regression algorithm only works when the relationship between the data is linear, suppose if we have non-linear data then linear regression will not be capable to draw a best-fit line and it fails in such conditions.
Consider the below diagram which has a non-linear relationship and you can see the Linear regression results on it, which does not perform well and doesn’t come close to reality.
Non-linear relationship between dependent and independent variables we add some polynomial terms to linear regression to convert it into Polynomial regression.
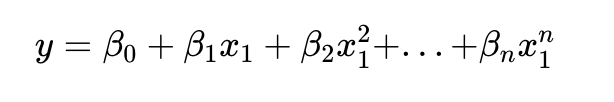
In statistics, polynomial regression is a form of regression analysis in which the relationship between the independent variable x and the dependent variable y is modelled as an nth degree polynomial in x.
Data Analysis and Results
Data Distribution
- To build a model to predict RSV hospitalization rate, what range of data to be included. one year or two year.
- Data distribution of RSV hospitalization rates from 2018 to till date.
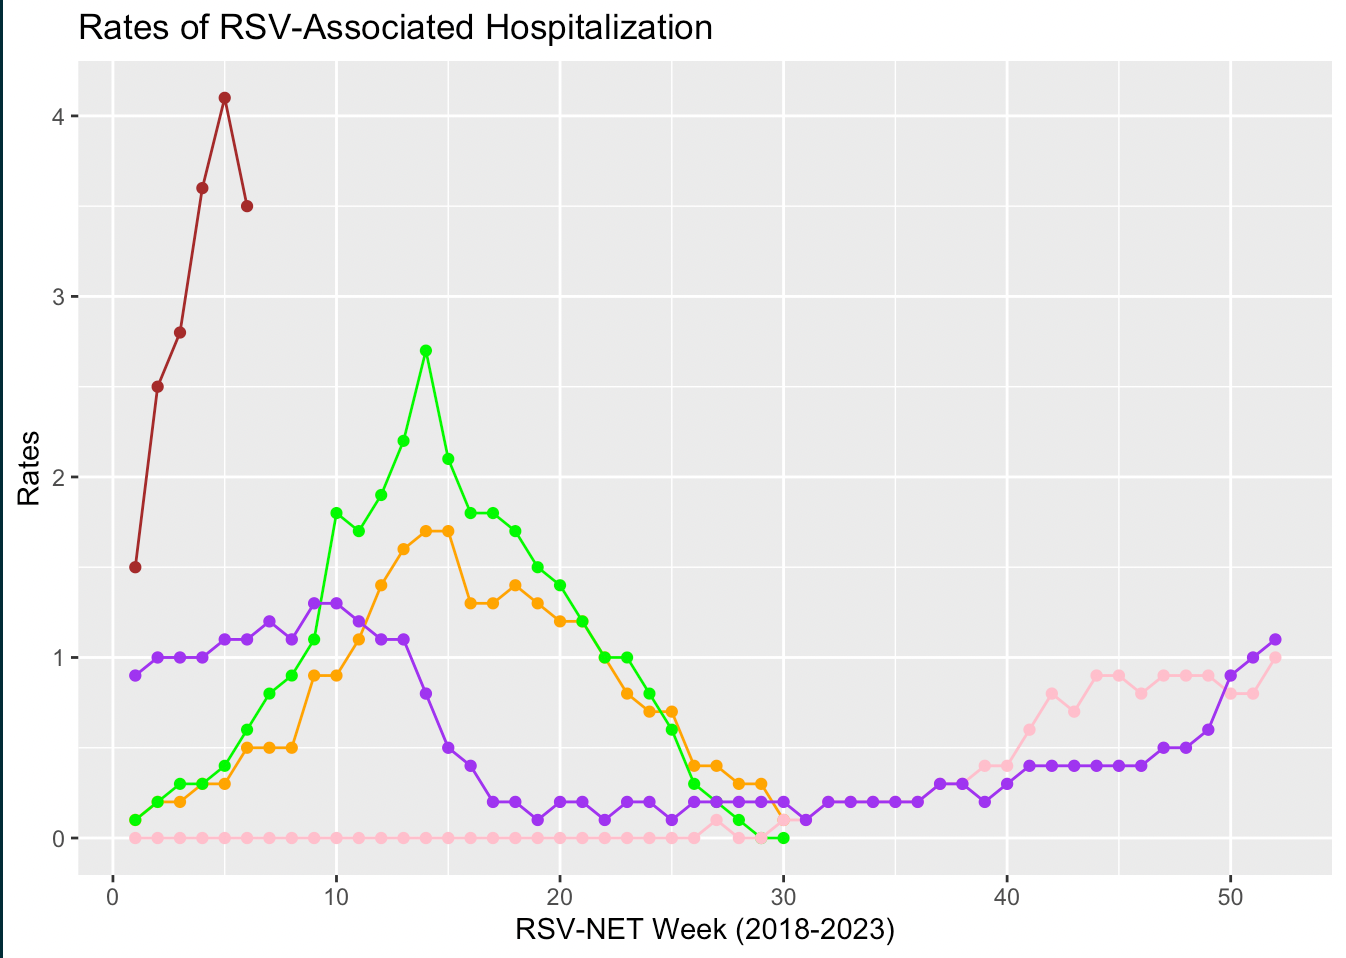
Legend:
  orange: 2018-2019
   green: 2019-2020
    pink: 2020-2021
  purple: 2021-2022
brown: 2022-2023- Data was examined before our modeling, including checking for missing values and removing outlines.
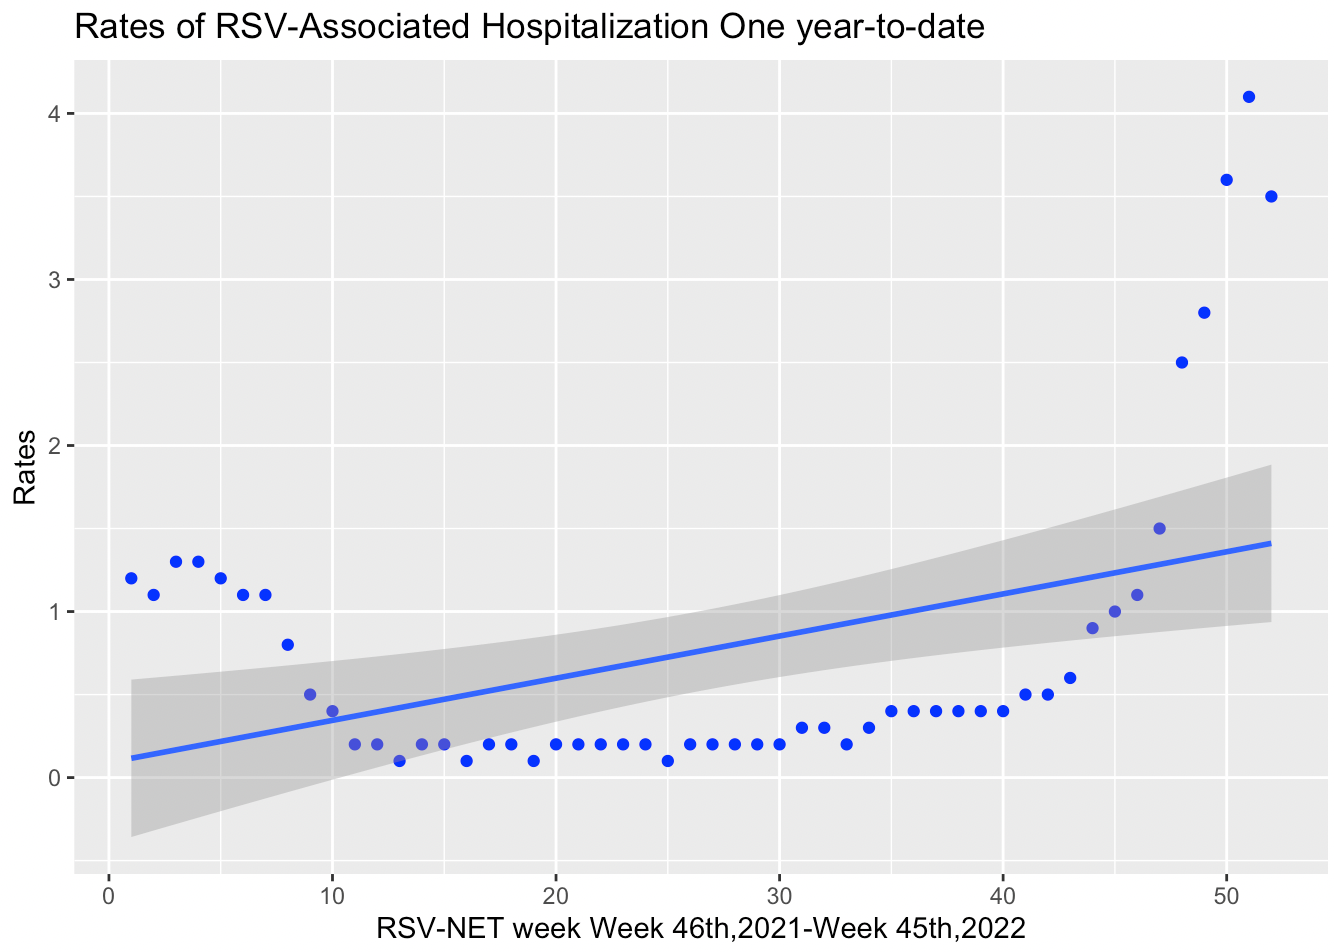
- One-year-to-date data distribution with a curve line.
- We can see that the straight line is unable to capture the patterns in the data.
- Data is being
under-fitting. - Polynomial regression is needed to increase the complexity of the model.
Two-year-to-date data distribution with a curve line was shown below.
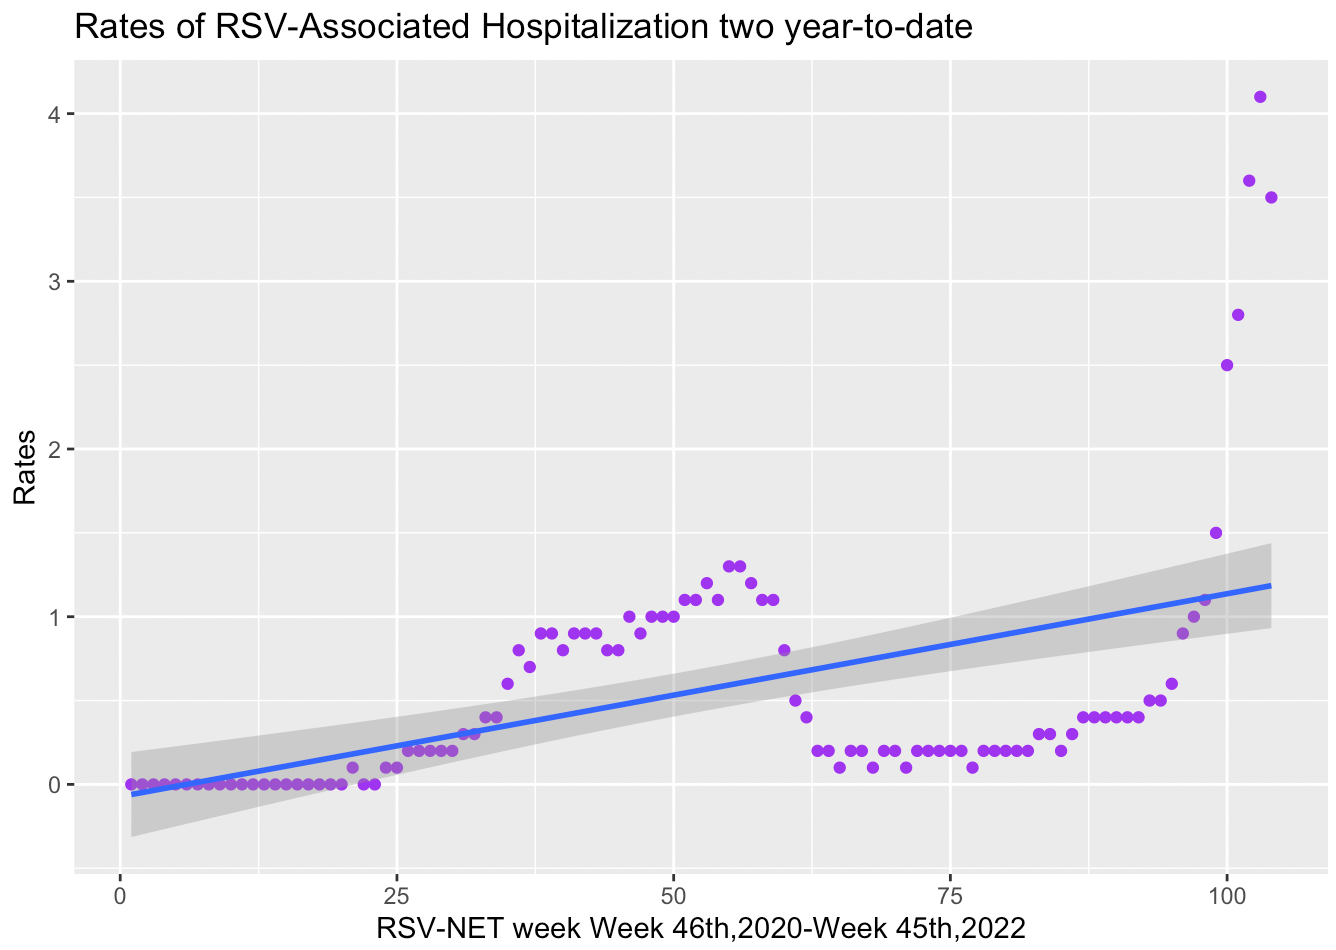
- Data is
under-fitting. - Polynomial regression is needed to increase the complexity of the model.
Polynomial Regression
One year (2021-2022)
- The best model we looking for is the one with high multiple R square
(0.9606)and low RMSE(0.16), so we select the model with degree of6.

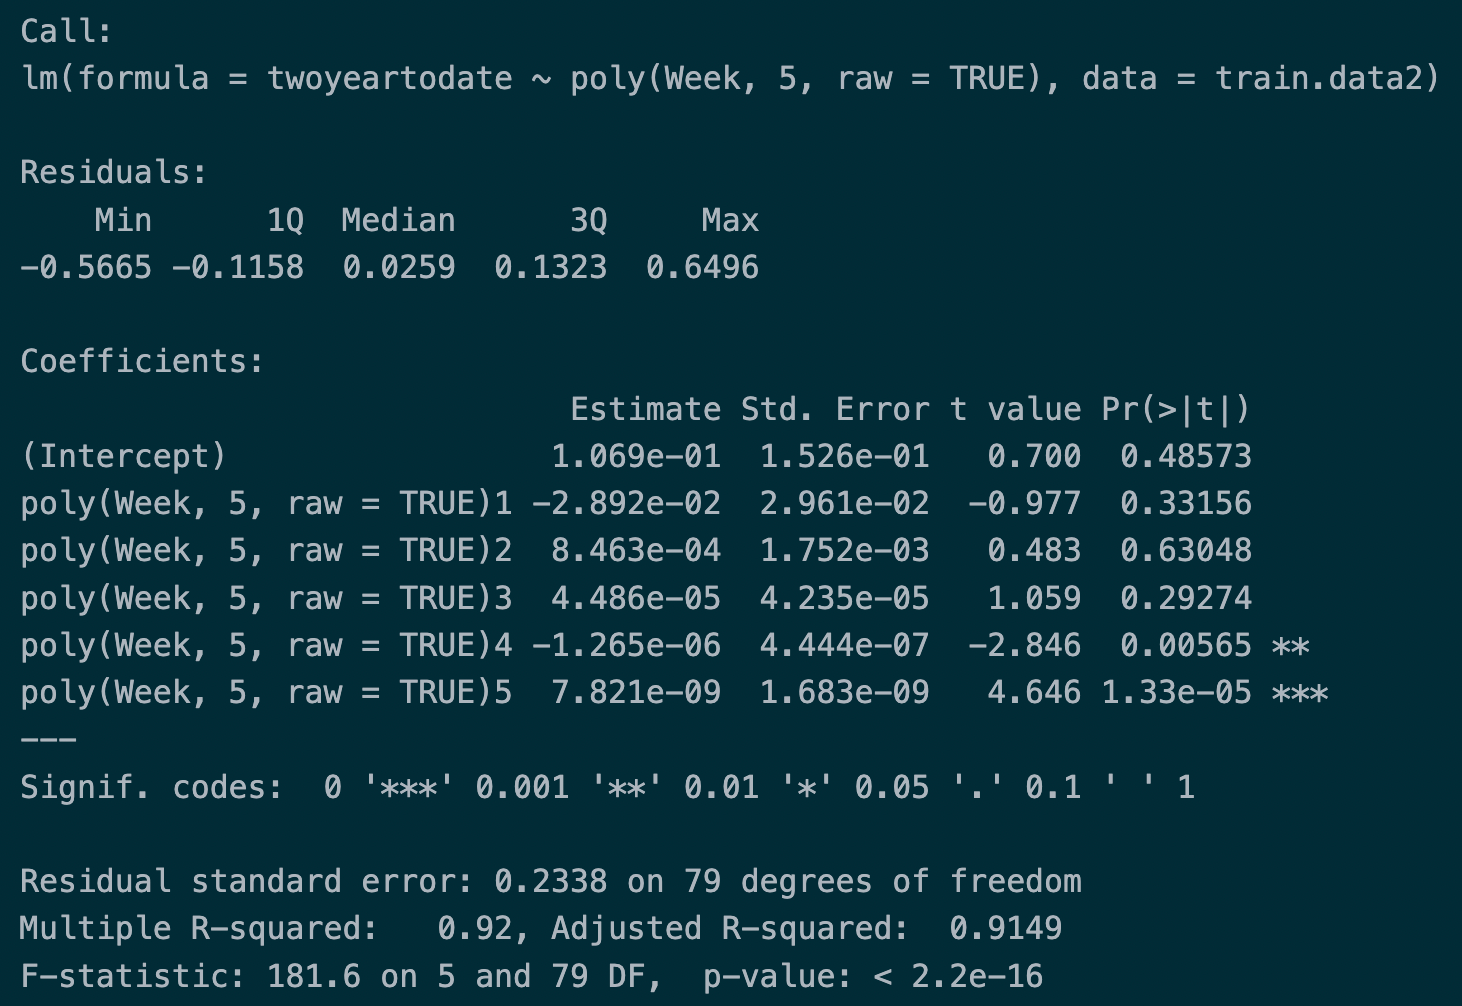
Two Year (2020-2022)
- The best model for the most recent two year data is at the degree of
5with multiple r-square0.92and error0.24.

Polynomial Regression
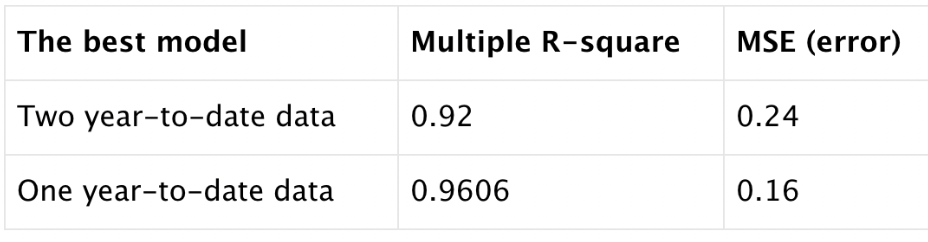
By comparing the two datasets, two year-to-date data with the one year-to-date data, it shows that building RSV hospitalization rate model containing most recent one year data creates a best prediction model.
Model Performance
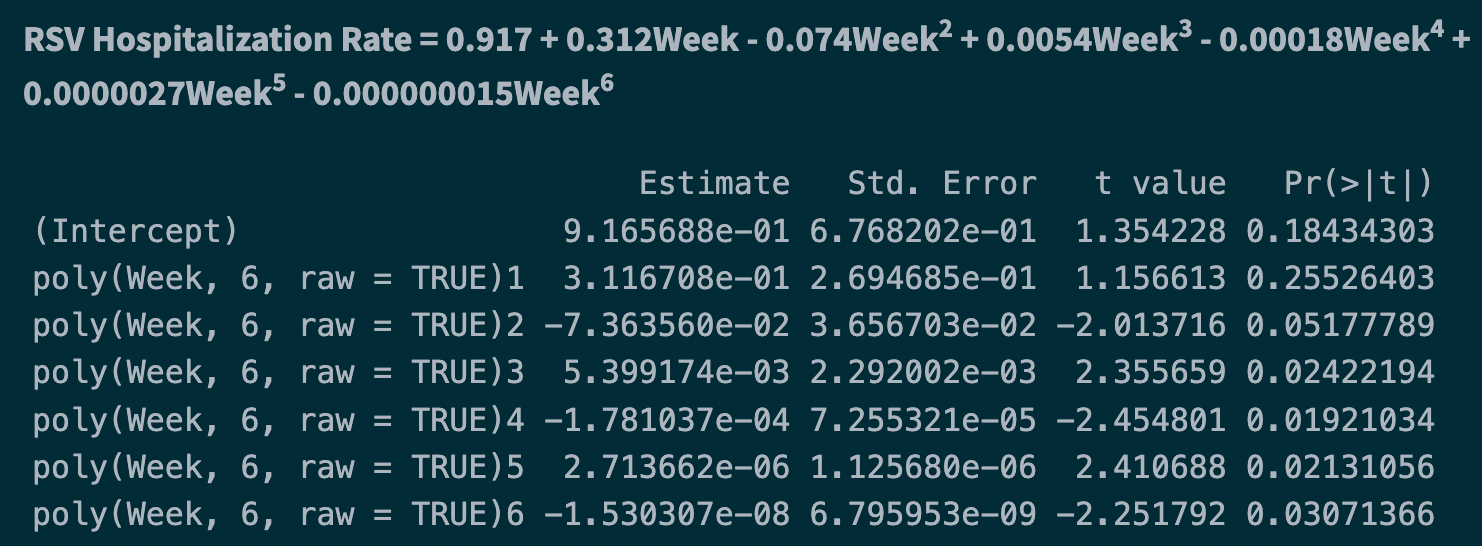
Model for RSV hospitalization rate from Nov, 2021 to Nov, 2022 is,
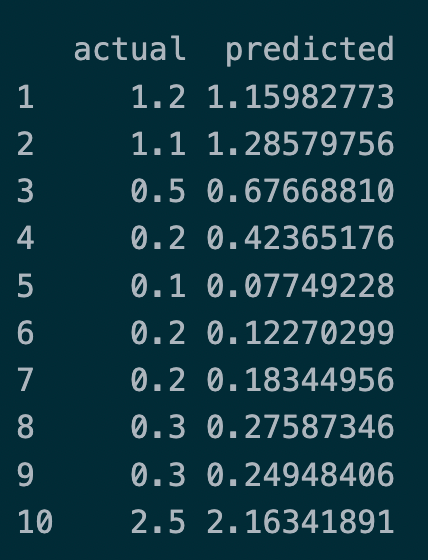
When we compare the actual hospitalization with the predicted value from our model, we can get the numbers as follows.
Final Model
We can conclude that the model created is a good fit. It is shown as a graph below. 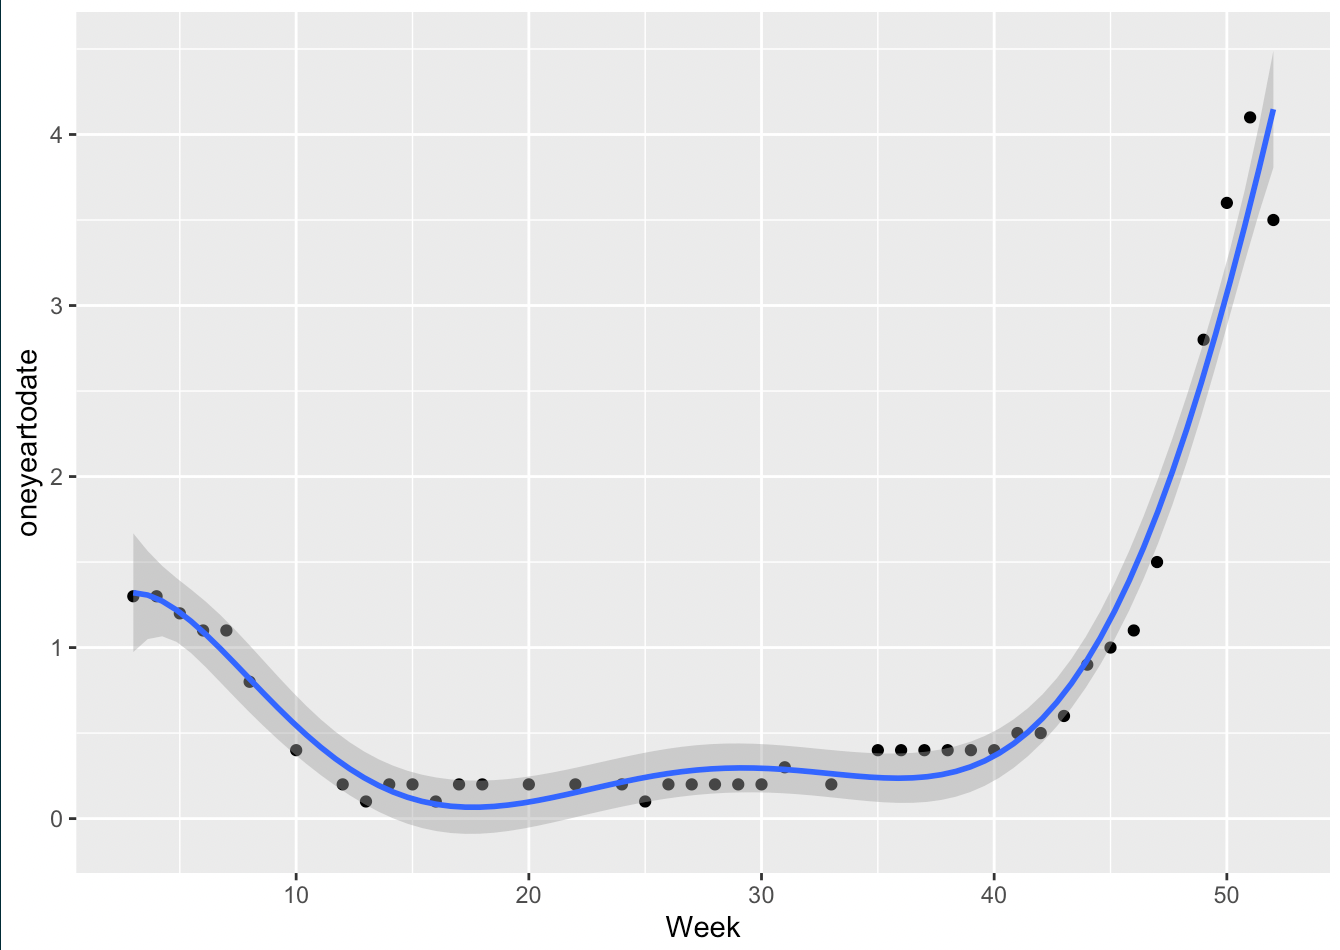
Prediction
We have got our model with the equation for the RSV hospitalization rate using last one year data:
RSV Hospitalization Rate(y):
Y = 0.917 + 0.312Week - 0.074Week2 + 0.0054Week3 - 0.00018Week4 + 0.0000027Week5 - 0.000000015Week6
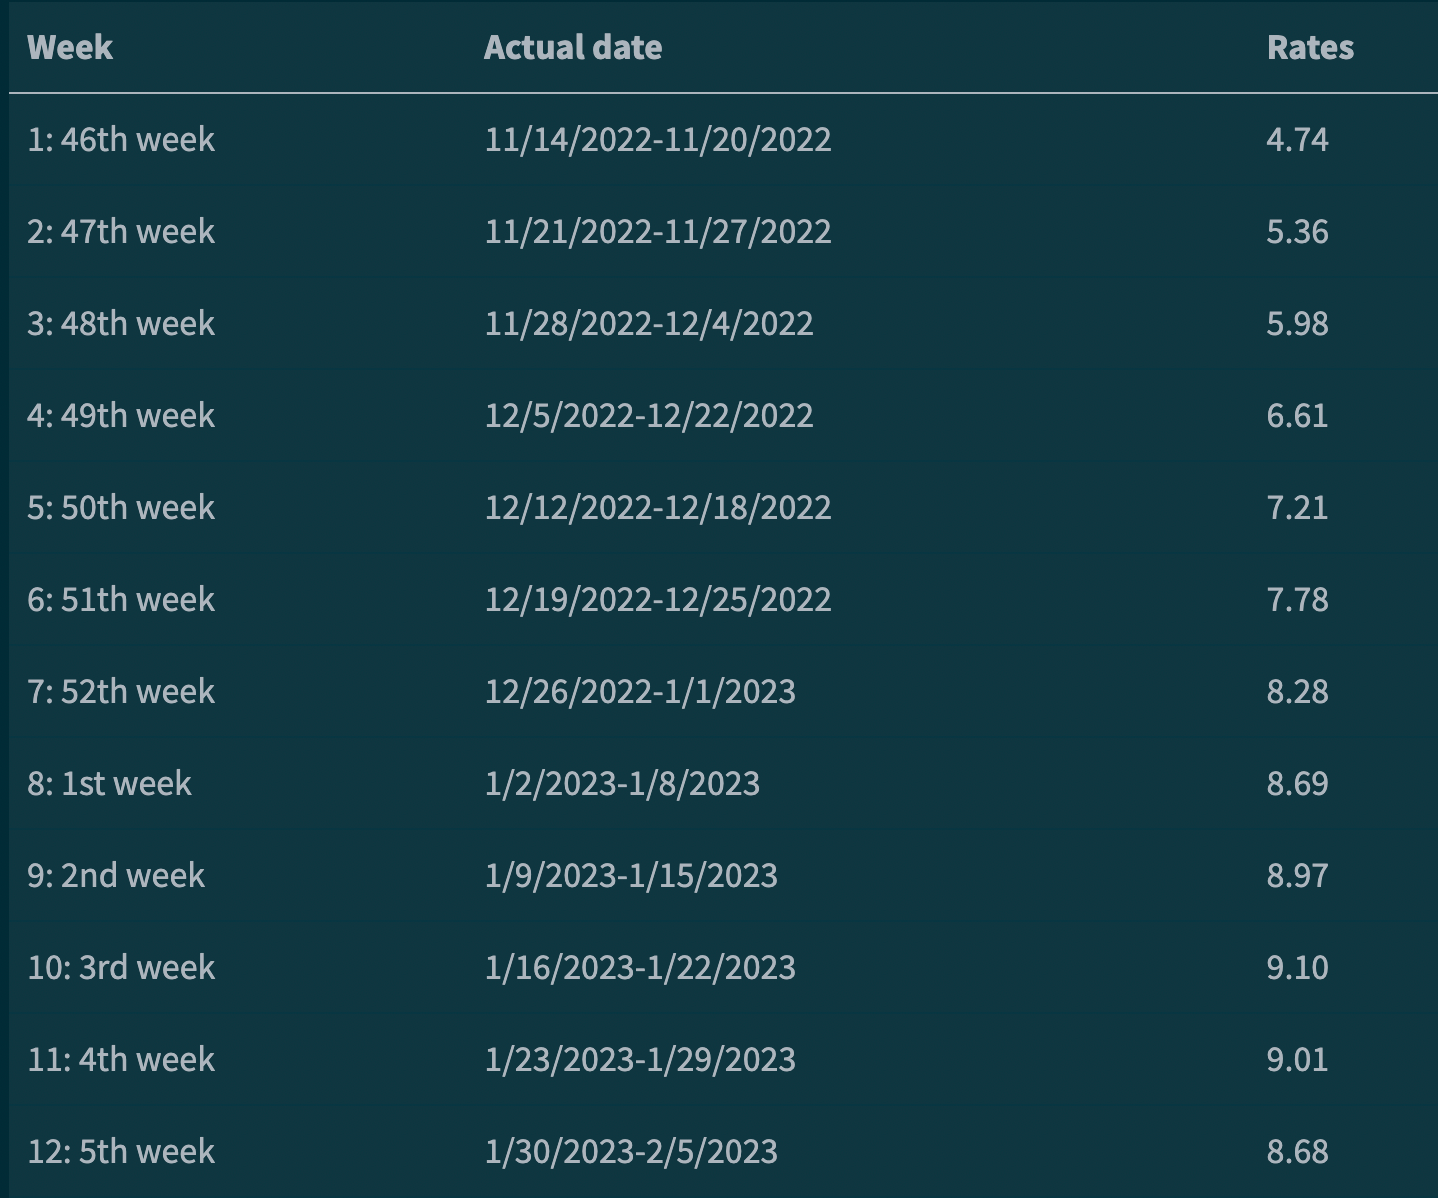
- RSV hospitalization rates in the next three months. A table is listed below to show the trend.
- Following the trend in our model, rates keep going up and a
rate of 9could be reached at the beginning of next year.